Tag Archive for: rural poverty

Taking Stock of Rural America

5 DECADES OF TAKING STOCK IN RURAL AMERICA

RURAL PEOPLE, RURAL PLACES, RURAL HOUSING

First published in 1984, Taking Stock is a decennial research publication of the Housing Assistance Council. The 2023 edition of Taking Stock continues this legacy of presenting social, economic, and housing trends for rural places and rural people.


In the early 1980s, the Housing Assistance Council (HAC) published its initial Taking Stock report. This seminal work was one of the first comprehensive assessments of rural housing and rural poverty conditions in the United States. The first Taking Stock also exposed the plight and housing need of the nation’s high poverty rural areas. HAC’s decennial Taking Stock analysis continued in 1990, 2000, and 2010 and has increasingly expanded to cover a broader scope of social, economic, and housing trends in rural areas. The 2023 edition of Taking Stock continues its legacy of presenting a composite picture of trends and issues important to rural people, places, and housing.

The Persistence of Poverty in Rural America

Persistently poor counties are classified as having poverty rates of 20 percent or more for three consecutive decades. Using this metric, the Housing Assistance Council estimates there were 377 persistently poor counties in 2020 using data from the Census Bureau’s recently released 2016-2020 American Community Survey, the 2006-2010 American Community Survey and the 2000 Decennial Census of Population and Housing.

Download Research Brief (PDF)

Working together to house America’s rural veterans

The Housing Assistance Council proudly supports the women and men who have served our country. Unfortunately, more than 3 million of our nation’s veterans live in sub-standard housing. According to HUD’s 2018 National Point In Time Homeless Count nearly 40,000 veterans are homeless. As a nation, we can do better to ensure those who have given so much for our country have decent, safe, and healthy places to call home. Together with critical backing from The Home Depot Foundation, HAC’s Affordable Housing for Rural Veterans (AHRV) initiative supports local nonprofit housing development organizations that provide and or maintain affordable housing needs of veterans in rural places. Since 2013, HAC and The Home Depot Foundation have partnered to invest approximately $3 million in grant funding to 61 nonprofits to support the rehabilitation, modification and or development of 615 units of veteran housing.

Together, we can give back and help meet the housing needs of rural veterans!

HAC is currently accepting applications for its AHRV Initiative through 5PM ET on Friday, November 15, 2019.


Learn more about the recipients of the 2019 Affordable Housing for Rural Veterans awards.

How many veterans live in your community? Visit Veterans Data Central to find data and information about veterans across the country.

navy diversity

Disconnect in Rural America - Rural Research Brief

Disconnect in Rural America

Disconnect in Rural America - Rural Research NoteDespite mass adoption, greater functionality, and more access points, the internet remains out of reach for many Americans, especially those in rural communities. One of the primary reasons for this disconnect is geography, where long distances between homes raise the cost of installing the infrastructure for broadband in rural areas, leaving rural homes with less access to fast, reliable internet.

As broadband becomes less a luxury and more a daily necessity, this technology gap can leave segments of the rural population technologically behind, causing slow economic growth, and limited access to advancements in areas, such as telemedicine.

More Than One-Quarter of Rural Homes Do Not Have Internet Subscriptions

Overall, 27 percent of all rural households lack any type of broadband subscription, compared to 17.1 percent of metropolitan households. This amounts to more than 4.7 million rural households without a broadband internet subscription – cellular data plan, cable/DSL/fiber optic, or satellite.

In addition, 129,963 rural households with an internet subscription are still using dial-up. This is 1 percent of all rural households with internet subscriptions, while only .04 percent of subscribers in metro areas have dial-up subscriptions.

The digital gap applies to most types of internet access, as measured by subscription data from the U.S. Census Bureau. Broadband subscription rates, at least in part, reflect access to the internet based on existing infrastructure and affordability. For example, rural households are less likely to have a cellular data plan than metropolitan area households, 57 percent to 70 percent. The one exception to this gap is satellite-based service. Nine percent of rural Disparities in Rural Broadband Subscriptions Across Income Levels
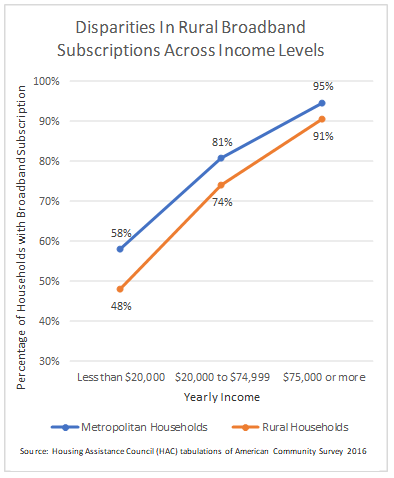
households, compared to 6 percent of metropolitan area households use satellite internet services. Greater isolation and more sparse populations in rural areas likely explain the more common use of satellite technology, where cable or fiber optic services are not available.

The broadband gap between rural and metropolitan area households exists at all income levels. For households with incomes less than $20,000 a year, rural broadband subscriptions are 10 percentage points lower than in metropolitan areas. For households with incomes from $20,000 to $75,000 the gap persists albeit slightly smaller at 7 percentage points. Even at higher income levels – $75,000 and above – rural households have lower broadband subscription rates, 91 percent to 95 percent.

The same disparity in connectivity exists at all age ranges as well. Rural residents under 18 years old are less likely to have a broadband subscription compared to their metropolitan counterparts, 84 percent to 89 percent. The trend follows for residents between 18 and 64 years old, 81 percent to 88 percent, and for those 65 years and older, 62 percent to 73 percent.

So, while income and age may exacerbate the disparity in broadband subscriptions, subscription rates in rural areas continue to trail metropolitan areas across the board.

Rural Homes Lack Device Diversity

Rural households also have fewer computing devices than their metropolitan area counterparts. About 83 percent of rural households have at least one computing devices (smartphone, tablet, laptop, etc.), while 90 percent of metropolitan area households do. Furthermore, less than 67 percent of rural households have at least two devices, compared to almost 75 percent of metropolitan households.

Rural households with access to some type of computing device are more often limited, with access to either a smartphone or a desktop computer, rather than having the capability and benefits of both forms of technology. While seemingly a small issue, fewer devices directly impacts rural households’ ability to take advantage of ever increasing technologies. This means that a rural home buyer with only a smartphone may not be able to obtain detailed information on mortgage products, and a veteran without a smartphone cannot get on the road directions to a VA healthcare facility for an appointment.

What the Disconnect Means

While it may not be surprising that rural households have less broadband access and fewer devices, it can be consequential. Less dense areas where there are large physical gaps in infrastructure is where the internet can be the best utilized. Households without broadband subscriptions are unable to access services effectively, such as online banking and shopping, telemedicine, and more reliable communication.

Investing in broadband infrastructure in rural areas can help diminish the disparities in access between rural and metropolitan households. While initial infrastructure investments may not be deemed profitable by traditional providers currently, small and local municipalities may need to consider creative methods of bringing broadband to their rural communities.

“Rural” in this Note refers to population and territory outside of a Metropolitan Area, as designated by the Office of Management and Budget.

Rural Voices: Working Toward Access for All

50 Years of the Fair Housing Act

Safe and affordable homes, free of discrimination, should be equally accessible to all. This edition of Rural Voices explores the state of fair housing half a century after the adoption of the Fair Housing Act and includes contributions from a federal agency, national nonprofits, and practitioners in the field.

VIEW FROM WASHINGTON

HUD’s Fair Housing Office: Combating Discrimination
Anna María Farías

In a nation founded on the principles of justice and equality, it is unacceptable for anyone to be denied the housing of their choice.

FEATURES

Working Towards Fair Housing in 2018’s Rural America
by Leslie R. Strauss

Rural fair housing advocates rely on outreach, education, cultural sensitivity, and partnerships to address issues that may not have been evident 50 years ago.

HUD Suspends Implementation of Affirmatively Furthering Fair Housing Rule
by Renee Williams

In early 2018 HUD suspended implementation of a regulation put into place in 2015.

Vermont Tackles Fair Housing Along with Housing Affordability
by Ted Wimpey

Vermont’s Fair Housing Project encourages residents and local governments to improve zoning and permitting in order to further fair housing and the development of affordable housing.

Disasters Don’t Discriminate, Recovery Shouldn’t Either
by Maddie Sloan

Disaster recovery must be designed to be fair for all, even if pre-disaster housing situations were not.

Nuisance and Crime-Free Ordinances: The Next Fair Housing Frontier
by Renee Williams and Marie Flannery

Fair housing laws may conflict with local laws and policies that penalize tenants for calling law enforcement or having a history of arrest or conviction.

Fighting Hate with Fair Housing Laws

The recent increase in hate crimes includes housing-related hate activity, which can have criminal or civil remedies.

Fighting Hate in North Dakota
by Michelle Rydz

A statewide coalition supports victims of hate crimes, including crimes that are related to housing.

INFOGRAPHIC

rv-may-2018-infographicFair Housing in Rural America – By the Numbers


Rural Voices would like to hear what you have to say about one, or all, of these issues. Please comment on these stories by sending a tweet to #RuralVoicesMag, discuss on the Rural Affordable Housing Group on LinkedIn, or on our Facebook page.

FY18 Spending Agreement Increases Funds for Some Housing Programs

Congressional negotiatiors agreed March 21, 2018 on an omnibus appropriations package for FY18, the fiscal year that began October 1, 2017. The bill is expected to pass both the House and Senate, and to be signed into law by President Trump, before midnight on March 23. The bill maintains or increases funding levels for both USDA and HUD housing programs. In fact, because the cap on FY18 spending levels was raised, funding levels for several programs were increased above the amounts in both the House and Senate FY18 bills. These include Section 502 direct homeownership loans, Section 515 direct rental loans, Section 542 vouchers, and others at USDA. At HUD, there are increases for HOME, CDBG, Section 202, Section 811, the Public Housing Capital Fund, tenant-based and project-based vouchers, and others.

The final bill does not include the Rural Economic Infrastructure Grants proposed in the Administration’s FY18 budget.

Congress has recently taken the first steps towards FY19 funding decisions, beginning to hold hearings on the Administration’s budget requests. HAC will continue to report on this process as it moves forward.

[tdborder][/tdborder]

USDA Rural Dev. Prog.
(dollars in millions)

FY16 Approp.

FY17 Approp.

FY18 House Bill (H.R. 3268)

FY18 Senate Bill (S. 1603)

FY18 Final Approp.

502 Single Fam. Direct
Self-Help setaside

$900
5

$1,000
5

$900
5

$1,000
5

$1,100
5

502 Single Family Guar.

24,000

24,000

24,000

24,000

24,000

504 VLI Repair Loans

26.3

26.3

24

26.3

28

504 VLI Repair Grants

28.7

28.7

a

28.7

30

515 Rental Hsg. Direct Lns.

28.4

35

28.4

35

40

514 Farm Labor Hsg. Lns.

23.9

23.9

15

23.8

23

516 Farm Labor Hsg. Grts.

8.3

8.3

6

8.3

8.4

521 Rental Assistance

1,390

1,405

1,345

1,345

1,345

523 Self-Help TA

27.5

30

25

30

30

533 Hsg. Prsrv. Grants

3.5

5

a

5

10

538 Rental Hsg. Guar.

150

230

230

230

230

Rental Prsrv. Demo. (MPR)

22

22

15

22

22

542 Rural Hsg. Vouchers

15

19.4

20

19.4

25

Rural Cmnty. Dev’t Init.

4

4

0

4

4

a. Section 504 grants and Section 533 grants would have been rolled into a new Rural Economic Infrastructure Grant program. This change is not included in the final bill.

HUD Program
(dollars in millions)

FY16 Approp.

FY17 Approp.

FY18 House Bill (H.R. 3353)

FY18 Senate Bill (S. 1655)

FY18 Final Approp.

CDBG

$3,000

$3,000

$2,900

3,000

3,300

HOME

950

950

850

950

1,362

Self-Help Homeownshp. (SHOP)

10

10

10

10

10

Veterans Home Rehab

5.7

4

0

4

4

Tenant-Based RA
VASH setaside
Tribal VASH

19,628
60
0

20,292
40
7

20,487
577b
7

21,365
40
5

22,015
40
5

Project-Based Rental Asstnce.

10,622

10,816

11,082

11,507

11,515

Public Hsg. Capital Fund

1,900

1,942

1,850

1,945

2,750

Public Hsg. Operating Fund

4,500

4,400

4,400

4,500

4,550

Choice Neighbrhd. Initiative

125

137.5

20

50

150

Native Amer. Hsg. Block Grant

650

654

654

655

655

Homeless Assistance Grants

2,250

2,383

2,383

2,456

2,513

Hsg. Opps. for Persons w/ AIDS

335

356

356

330

375

202 Hsg. for Elderly

432.7

502.4

573

573

678

811 Hsg. for Disabled

150.6

146.2

147

147

230

Fair Housing

65.3

65.3

65.3

65.3

65

Healthy Homes & Lead Haz. Cntl.

110

145

130

160

230

Housing Counseling

47

55

50

47

55

FY19 Budget Proposes to Eliminate Most Rural Housing Programs

Guarantees for bank loans would remain at current levels and basic rent aid for tenants would continue, but other rural housing assistance would be wiped out under the Trump Administration’s budget proposal for fiscal year 2019 released on February 12, 2018. Although tenants would continue receiving assistance, they would face a new requirement to pay at least $50 per month in rent unless they are deemed to experience economic hardship.

This budget is much the same as last year’s proposal for rural housing. Last year the Section 504 grant program – which offers small grants to elderly homeowners with very low incomes to repair health and safety hazards in their homes – would have been rolled into a new pool of money called the Rural Economic Infrastructure Grant program. This year’s budget does not include that infrastructure grant proposal, and would simply eliminate Section 504 grants. The House incorporated the infrastructure grant idea into its FY18 appropriations bill, but both the House and the Senate rejected most of the program eliminations proposed by the Administration last year.

The guarantee programs that would remain – Section 502 guarantees for homebuyers and Section 538 guarantees for builders of rental housing in rural places – cover their own costs through fees, so the government pays only the costs of administering them.

USDA’s Section 521 Rental Assistance and Section 542 voucher programs, which assist tenants in two different sets of circumstances, would be funded at levels similar to current amounts. The $20 million proposed for vouchers, however, is too low to help all eligible tenants who want vouchers. HAC believes at least $27 million will be needed for these renters whose landlords pay off their USDA mortgages, either early or at maturity.

In addition to the new $50 rent requirement, the budget proposes to allow USDA to recapture Rental Assistance funds from past years’ agreements if the department determines a property no longer needs RA, and to use those funds for other properties. It would also let USDA transfer unneeded RA or voucher funds to any other rural housing programs. [tdborder][/tdborder]

USDA Rural Dev. Prog.
(dollars in millions)

FY16 Approp.

FY17 Approp.

FY18 House Bill (H.R. 3268)a

FY18 Senate Bill (S. 1603)a

FY19 Admin Budget Proposal

502 Single Fam. Direct
Self-Help setaside

$900
5

$1,000
5

$900
5

$1,000
5

0
0

502 Single Family Guar.

24,000

24,000

24,000

24,000

24,000

504 VLI Repair Loans

26.3

26.3

24

26.3

0

504 VLI Repair Grants

28.7

28.7

c

28.7

0

515 Rental Hsg. Direct Lns.

28.4

35

28.4

35

0

514 Farm Labor Hsg. Lns.

23.9

23.9

15

23.8

0

516 Farm Labor Hsg. Grts.

8.3

8.3

6

8.3

0

521 Rental Assistance

1,390

1,405b

1,345

1,345

1,331.4b

523 Self-Help TA

27.5

30

25

30

0

533 Hsg. Prsrv. Grants

3.5

5

a

5

0

538 Rental Hsg. Guar.

150

230

230

230

250

Rental Prsrv. Demo. (MPR)

22

22

15

22

0

542 Rural Hsg. Vouchers

15

19.4

20

19.4

20

Rural Cmnty. Dev’t Init.

4

4

0

4

0

a. FY18 appropriation is not yet final.
b. Includes $40 million in advance funding for FY18, so total available in FY17 was $1.365 billion and total available in FY18 would be $1.385 billion. The FY19 budget assumes that this “forward funding” continues, so more than $1.331 billion would be available in FY19.
c. Section 504 loans and other non-housing loans would have been rolled into a new Rural Economic Infrastructure Grant program.

Broadband to house - USDA

Rural Research Note Homelessness - Cover

Homeless Rate Increases Nationally: Rural Data Remains Unclear

Cover of Homeless Rate Increases Nationally: Rural Data Remains UnclearHUD’s 2017 point-in-time numbers show the homeless count increased by 0.7% nationally since 2016, which is the first increase since 2010. The overall number has actually decreased when excluding several large cities that have experienced extreme spikes in homeless populations. Homeless counts in rural communities continue to be hard to capture. The following research note highlights the impact of these highly populated areas on the overall homeless count and points out the difficulty in counting the rural homeless population.

Read the Research Note

rrn-homelessness-2017-chart

Housing as Infrastructure

by Stephen Sugg,Housing Assistance Council (HAC)

We know that decent and affordable housing does great (and cost-effective) things like prevent lead poisoning, improve health outcomes, and boost student achievement in school. Rural affordable housing is an economic driver. And a lack of rural affordable housing is thwarting economic growth and job creation. Thus, HAC and our rural partners in 50 states are among the growing number of voices viewing housing as infrastructure. One rural small business developer said it best, calling intertwined issues of workforce recruitment and housing stock availability the “two biggest challenges that rural areas tend to be worried about”.

Those working in the metro DC area and other relatively affluent enclaves are accustomed to construction cranes hovering, young professionals sipping lattes that are the price of a burger and fries in a rural diner, and paying outrageous rents.

It is different in rural America. Available housing is often dilapidated, not energy-efficient, and though comparatively cheap, still unaffordable for the working poor, or most vulnerable. Grandma might have a $800 heating bill for her Jimmy Carter era manufactured home. Rural incomes are 25% less on average than non-rural, and this statistic is worse for rural areas mired in persistent poverty. But bottom line focused rural leaders know that affordable housing creates jobs—short and long term, while offering “immediate fiscal benefits” for states and localities.

Rural businesses too often struggle, with lumber catching dust at the lumber yard; building supplies hardly moving at the hardware store. Immediate economic impact would come from investment that is guaranteed to stay local, help local people, and that is “shovel ready” (and then some). It might even help stem the onslaught of rural hospital closures.

I’d challenge folks from the Trump Administration, starting with HUD Secretary Ben Carson, to join a bipartisan group of Congressional leaders and my colleagues and me on a journey—perhaps over the next Congressional recess. Start in Appalachia, say rural eastern Kentucky, and ask the folks there if federal infrastructure investment in housing would be wise. Imagine out-of-work miners constructing “self-help” homes, their sweat equity again paying a dividend, along with de facto job training.

Then go north, to Pine Ridge in South Dakota, where 18 people crowding into a house is still too common, a place that Nicholas Kristof called “Poverty’s Poster Child”. Ask them about the immediate impact of improved housing conditions.

Traditional log home - between Oglala and Pine Ridge villageTraditional log home – between Oglala and Pine Ridge village

Next fly south, to the Colonias on the U.S.-Mexico border, where housing is in short supply, and modern sewage systems are too rare. In the Colonias, even modest investment does much good, as creative nonprofits are doing cutting-edge work. Going westward (or any direction, really), one could visit the homes of farmworkers, and see the substandard housing conditions of those responsible for making sure that we eat.

For those wanting some recreation with their fact finding mission, they would need not go to counties mired in persistent poverty—85% of which are rural. Rural resort towns (e.g., “tourist areas”) are filled with housing need. Those in the service industry are often part of rural America’s hidden homelessness epidemic. And make no mistake: investment in affordable rural housing plays a critical role in addressing rural America’s opioid crisis. Citylab called the opioid epidemic an “infrastructure issue”, citing the need for rural transitional housing.

In rural America, where costs are lower for construction and land, infrastructure spending targeted toward housing—preservation or new—can boost the outlook for Main Street while providing an anchor for our most vulnerable families to achieve stability, and a shot at the middle class.

Last year, over 7 million households in rural America experienced at least one major housing problem. We can do better, and political will is all that it takes.

This post is part of a series from members of the Campaign for Housing and Community Development Funding tying housing to infrastructure. Read the first post in the series from the National Housing Conference.

Income Inequality in Rural America

HAC Executive Director Moises Loza submitted the following Letter to the Editor to the Washington Post on June 27, 2016.

“The rural reaches of income inequality” (June 26) raises issues that are too often ignored. As the Housing Assistance Council works to improve housing conditions for low-income rural Americans, we are well aware of the consequences of income inequality. In places with significant income differences, the wealthy depend on service workers but those who wait tables, work in retail, clean homes, and maintain lawns cannot afford decent homes near their jobs.

There are other costs as well. For example, USDA’s Economic Research Service has identified the growth in income inequality as the major factor increasing rural child poverty from 2003 to 2014. The Robert Wood Johnson Foundation and the University of Wisconsin Population Health Institute report that counties with high levels of child poverty and income inequality are often less healthy than those with lower levels. (Their study defined income inequality as the difference between the 20th and 80th percentiles rather than between the top 1 and bottom 99.)

Even without income inequality, of course, poverty can be dangerous. The Post’s interactive online map shows that in Oglala Lakota County, SD (formerly named Shannon County), the top 1 percent makes only 5.3 times as much as the bottom 99 percent. Income inequality is hardly a problem there, but deep, persistent poverty is. Oglala Lakota County, which lies entirely within the Pine Ridge Indian Reservation, has had a poverty rate well over 50 percent for decades. As a result, 51 percent of homes in the county are physically deficient and 26 percent are overcrowded.

Serious housing problems exist in other persistent poverty counties, as well. These areas, which tend to have low proportions of the extreme income inequality highlighted in the Post’s article, are concentrated in certain parts of the country: Native American lands, Appalachia, the Lower Mississippi Delta and the Southern Black Belt, and the colonias along the U.S.-Mexico border. Income and housing issues are common among farmworkers, as well, although those are not as visible on a map. Notably, minorities are the majority in five of these six regions and populations (Appalachia being the exception).

Thanks are due to the Post for its reporting and to the Economic Policy Institute for including rural places in its income inequality research. As income inequality, job opportunities, and race drive the politics of the day, we cannot continue to overlook their presence anywhere in the country.

Moises Loza
Executive Director
Housing Assistance Council