The COVID-19 pandemic is a global health crisis affecting nearly every community – including Rural America. While there are still many uncertainties, the health crisis changes daily and the pandemic’s impact on rural communities continues to grow and evolve. The Housing Assistance Council (HAC) presents summary findings of what we know about COVID-19 in rural America as of early August 2020.
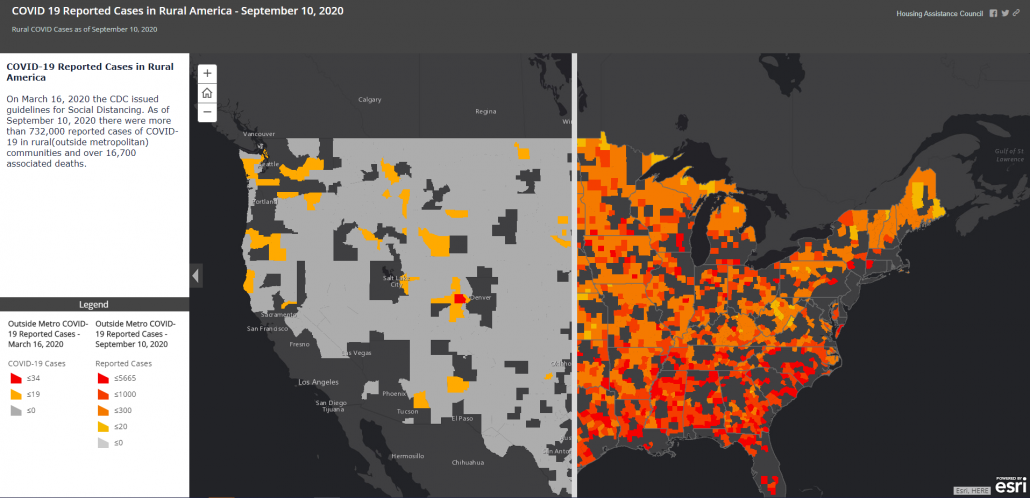
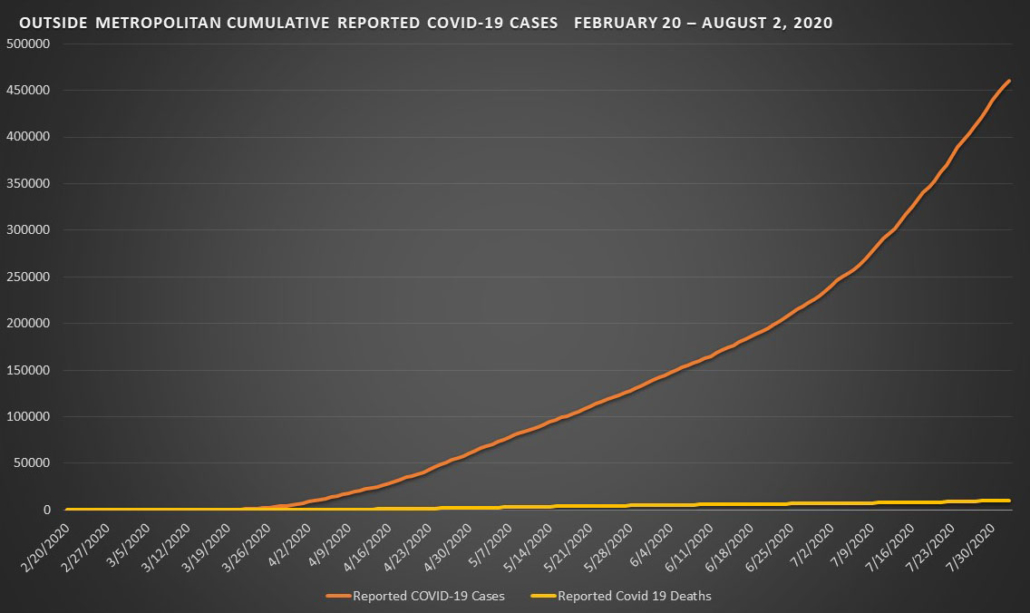
TOTAL REPORTED COVID-19 CASES FEBRUARY 20- AUGUST 2, 2020
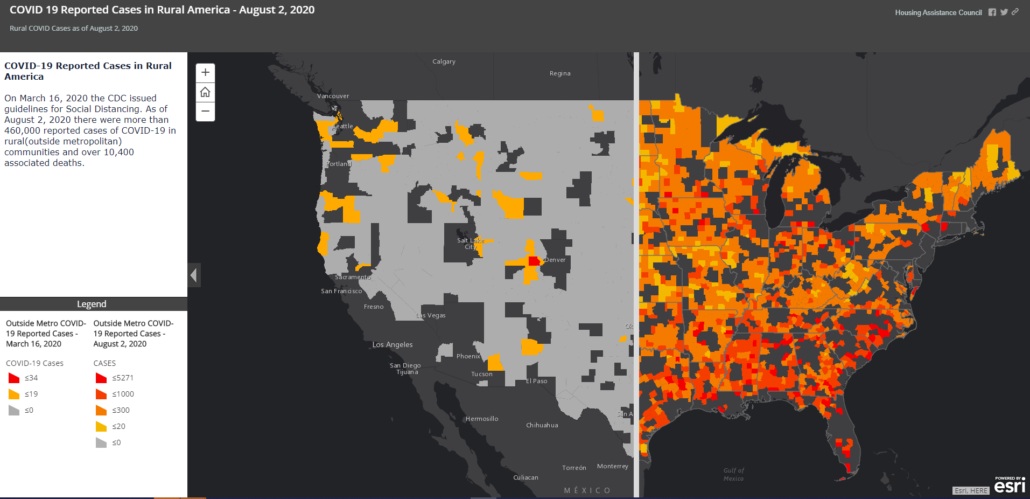
On March 16, 2020, the CDC issued guidelines for Social Distancing. As of August 2, 2020, there were more than 460,000 reported cases of COVID-19 and deaths from the virus have now surpassed 10,000 in communities outside of Metropolitan Areas. All but 32 counties outside of metropolitan areas have reported COVID-19 cases, and now over 60 percent of these counties have also reported associated deaths related to the virus.
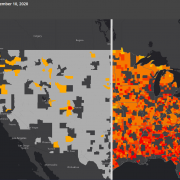
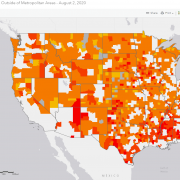
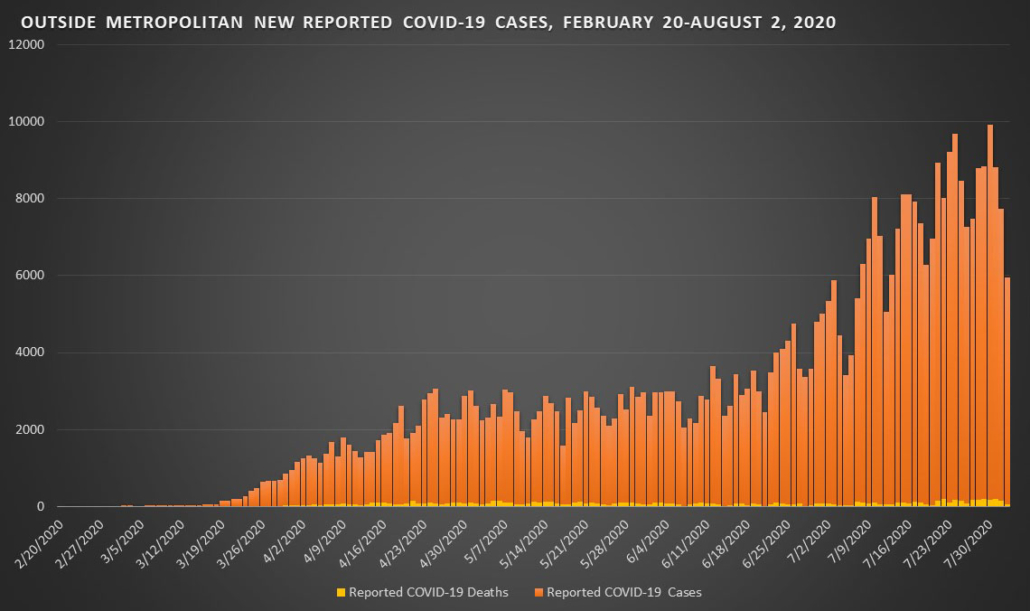
NEWLY REPORTED COVID-19 CASES FEBRUARY 20 – AUGUST 2, 2020
The level of new COVID-19 reported cases grew dramatically in July and the number of reported cases outside of metropolitan areas continued to skyrocket as well. From July 2 to August 2 there were almost as many new reported rural cases (225,553) than had been reported for the prior 5 months in total (235,201). There were a reported 3,381 rural deaths related to COVID-19 in the past month as well.
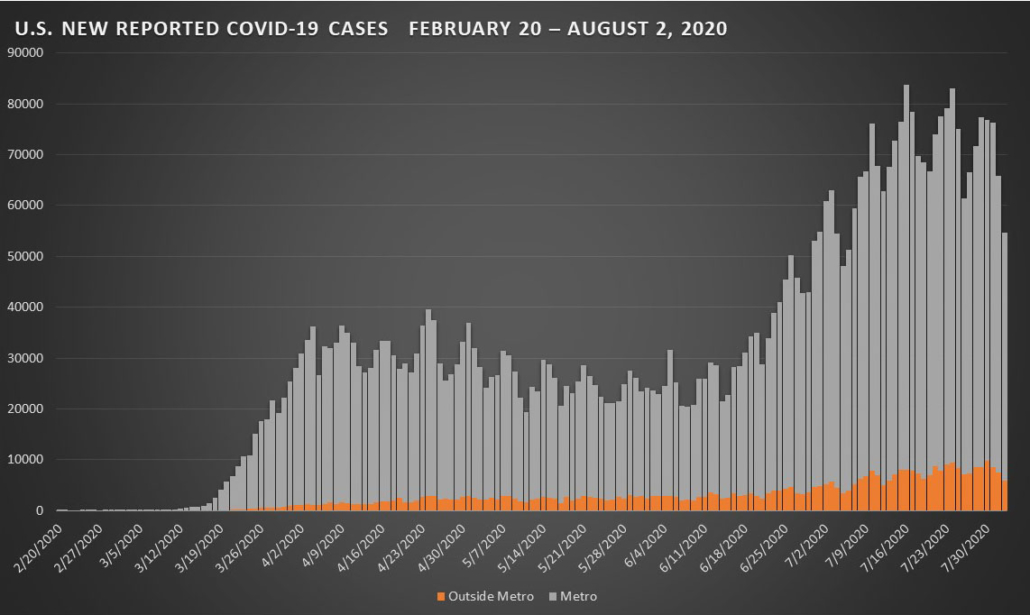
RURAL SHARE OF COVID-19 REPORTED CASES
Initial impacts of COVID-19 were greatest in urban communities and particularly devastating to some metropolitan areas. As of August 2, 2020, approximately 10 percent of COVID-19 cases and 7 percent of associated deaths have been reported in rural communities. But the rural share of COVID-19 cases continues to rise nationally.
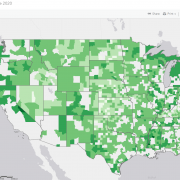
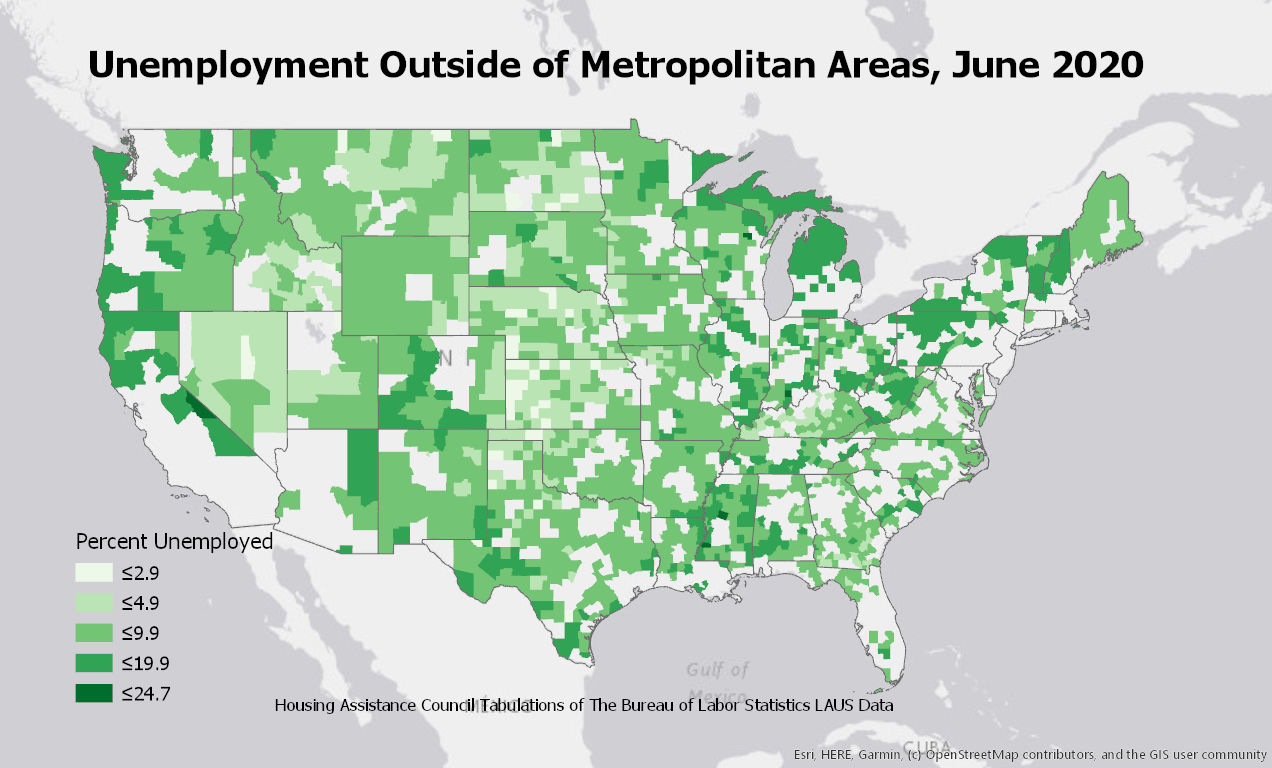
Reported Rural COVID-19 Rates per 100,000
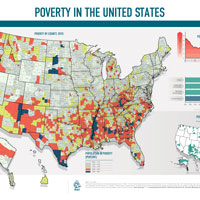
Over 98 percent of rural communities have reported COVID-19 cases, but the virus’ impacts vary widely across the nation’s rural geography. There are several instances of extremely high per-capita infection rates in rural areas – notably on some Native American lands and communities with meat packing and correctional facilities. From July 2- August 2, the case and death rates increased most dramatically in the rural Southeast.
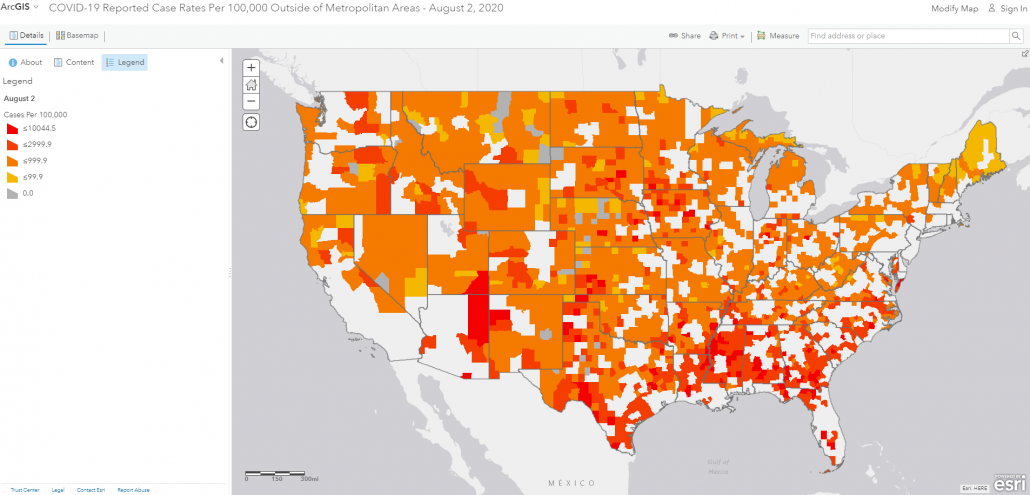
To access all graphics and interactive maps visit: https://arcg.is/1HH0H4.
ABOUT THE DATA
The information in this brief derives from Housing Assistance Council tabulations of data from The New York Times, based on reports from state and local health agencies, and the U.S. Census Bureau’s 2014-2018 American Community Survey.
In these analyses, the terms “rural” and Outside Metropolitan Areas are synonymous and refer to counties and counts outside of OMB designated Metropolitan Areas.