Revisiting Poverty in Rural America
Rory Doyle / There Is More Work To Be Done
Rory Doyle / There Is More Work To Be Done
By James P. Ziliak, Center for Poverty Research and Department of Economics, University of Kentucky
 This story appears in the 2014 Special Edition of Rural VoicesThe 50th anniversary of the War on Poverty has generated scores of articles, books, and radio and television reports. Lost in much of this coverage is the acute hardship facing rural America at the dawn of the 1960s and the role this played in shaping the nation’s response to poverty. Lack of access to adequate food and health care, along with quality schools, roads, and housing was rampant in many rural communities, especially in Appalachia and the Deep South. The public policy response reflected that need with the creation of programs such as food stamps, school lunch and breakfast, Medicaid, Medicare, Head Start, and, later on, Section 8 vouchers, and Low-Income Home Energy Assistance. This article provides a brief overview of poverty trends, and lingering challenges, facing parts of rural America.
In the United States, the official measure of poverty compares a family’s money income against a family-size specific threshold. Money income includes private income from wages and salaries, self-employment, rent/interest/dividend income, and government cash transfers such as Social Security, disability, veteran’s payments, unemployment, welfare, among others. This information is collected in March of each year as a supplement to the roughly 50,000 – 60,000 households in the monthly Current Population Survey, and the income information refers to the previous calendar year. The family is the basic reference unit for poverty measurement, where family means two or more persons residing together and related by marriage, birth, or adoption. The income of all family members is summed to yield total family income for the year. All members of the same family, including related subfamilies, share the same poverty status. It is important to note that this measure excludes many of the programs borne out of the War on Poverty, such as the dollar value of food stamps and housing subsidies, Medicaid and Medicare, and also excludes tax liabilities and the refundable Earned Income Tax Credit. Spending on these programs now exceeds $1 trillion, but they are not part of the official poverty rate.

The poverty threshold for a family is based on a 1955 survey of American families whereby it was determined that the average family of three or more persons spent about one-third of their after-tax money income on food purchases. This implies that after establishing the appropriate food budget one could use a multiplier of 3 to establish an income cutoff for minimally adequate needs. The food plan adopted in the 1960s was the least costly of four nutritionally adequate diets specified by the U.S. Department of Agriculture known as the ‘economy’ food plan. The poverty line was first implemented in 1967, and in each year since it has been updated by changes in the consumer price index. This means for purposes of poverty measurement we have allowed no adjustment for changes in the standard of living, including the fact that the average family of three spends closer to one-seventh of their budget on food today. In 2014 the poverty line for a single individual is $11,670 and for a family of four it is $23,850.
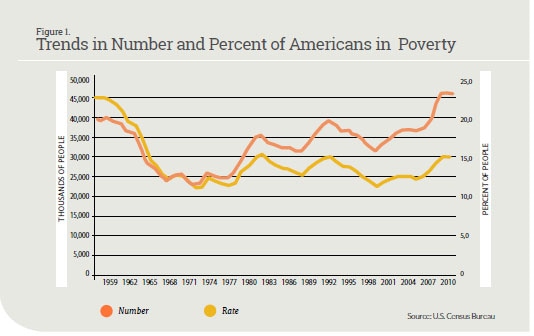
Figure 1 depicts trends in the national poverty rate, as well as the numbers of persons in poverty, from 1959 through 2011. As seen in the figure, the overall poverty rate was about 22 percent in 1959, and the number of Americans living in poverty was about 40 million. Within a decade, poverty fell by half. Since 1970, however, while moving up and down with the business cycle, both the poverty rate, and especially the number of poor, have trended upward such that in 2011, 15 percent of the population was poor, or over 45 million people. Research suggests that this post-1970 experience is due to a host of factors, the most prominent of which include the slowdown of economic growth, rising inequality (including declining inflation-adjusted wages among less-skilled workers), and the rise in female-headed families.
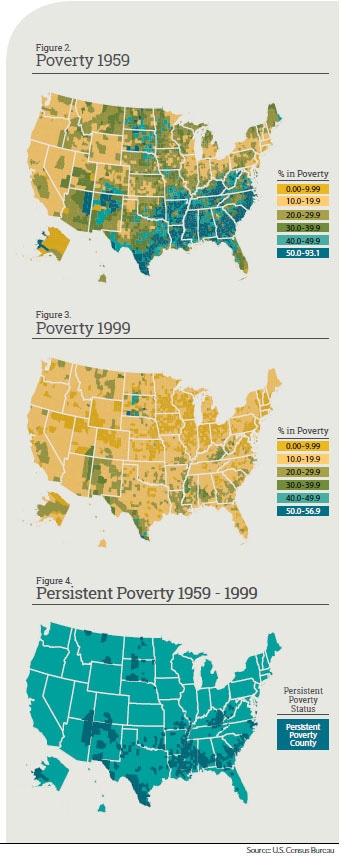
 What is missing from Figure 1 is the vast differences in poverty rates across the country. For example, while the overall poverty rate in 1959 was 22 percent, Figure 2, which depicts poverty rates at the county level from the 1960 Decennial Census, shows that in much of the rural South and Native American territories poverty rates exceeded 50 percent. It was this level of deep poverty that then-Senator John F. Kennedy witnessed during a campaign stop in West Virginia in his 1960 bid for the presidency, and subsequently shaped his domestic agenda and that of President Johnson.
Overall, rural America shared in the prosperity of the ensuing decades, such that by the end of the economic boom of the 1990s, the excessive high rates of poverty were mostly absent, as depicted in Figure 3. But upon closer examination what one sees is the emergence of pockets of persistently high poverty. Specifically, following the USDA definition, a persistently poor county is one with a poverty rate above 20 percent across Decennial Censuses. In Figure 4 this is represented across each Census year from 1960 to 2000. The figure shows that these persistently poor counties, which represent about 11 percent of all counties, are generally clustered in five regions: central Appalachia, the “Black Belt” region from the Carolinas to Alabama, the Mississippi Delta, the Texas “colonias,” and counties with Native American reservations in the western U.S. These five regions vary greatly in terms of race, ethnicity, geography, culture, and primary economic specialization. What they have in common, and what distinguishes them even from other rural counties, is low levels of formal education attainment, low labor force participation rates, low capital expenditures, and greater distance from urban economic hubs, which when combined, help explain the high rates of poverty persistence. An obvious question to ask is, which factor matters most?
Historical sociologists have theorized that patterns of land tenure in Appalachia and the Mississippi delta, where ownership was highly concentrated, led to the development of institutions that contribute to those regions’ low incomes today. Macroeconomists have also pointed to the role of climate and geography; namely, temperate climates have more predictable rainfall, better soil quality, and lower disease prevalence than tropical areas. Again in the U.S. context, this may place the coastal regions at an advantage relative to the South and Appalachia.
In a recent study at the Center for Poverty Research at the University of Kentucky, we run a “horse race” of sorts to understand whether the persistently poor counties are where they are economically because of lower levels of human and physical capital, less efficient use of their human and physical resources, or from historical contributions of institutions, culture, and geography. Our research points to the key role that education plays both contemporaneously and historically in the development of these poor counties—shortfalls in human capital account for about 60 percent of the income gap between persistently poor and non-poor counties. While persistently poor counties historically were also warmer, had lower stocks of physical capital, fewer foreign-born residents, and were less urban, what really stands out is that persistently poor counties today had, on average, illiteracy rates 25 percentage points higher than did non-poor counties a century ago. In recent decades, gains have been made in closing the gap in high school graduation rates, but while that gap narrowed, the gap in college completion rates widened just as college was becoming more important for the economic success of families and communities. In other words, human capital has a long reach.
The most important factor contributing to persistent poverty in rural America today is low levels of human capital. While daunting, this is not an insurmountable barrier from a policy perspective. Substantial investment in education from prekindergarten through higher education, coupled with incentives to retain the recipients of the investments, are needed for poor rural regions to have a chance of catching up to the rest of the nation. These investments in education, coupled with economic development programs that aim to diversify the economic base around nearby urban centers, may offer a path out of persistent poverty.
Whether this investment should come from the state and local level, or the federal level, or both, is the subject of much debate. Most agree that state and local governments should invest in their local communities across a host of dimensions from education to health to business incentives, but if and how the federal government gets involved is another matter. If people are mobile across communities, and state lines, in response to additional opportunities offered by education, then there are clear grounds for federal investment in schooling from pre-K and beyond. However, investing in schooling is a long-term proposition and cannot be accomplished in isolation of present-day economic development needs—place-based policies such as infrastructure projects, business subsidies, and even public-works jobs akin to the Works Progress Administration after the Great Depression.
Proponents of place-based policy typically make an appeal on redistributive grounds, i.e. persistently poor regions are trapped and there is a national interest in ameliorating those deficits through direct investment. The case against such place-based intervention follows from the belief that helping poor places is not the same thing as helping poor people—business subsidies may just induce new firms to bring new migrants to the area and not hire locals. This drives up local prices harming the poor who tend to be renters. However, federal involvement cannot be ruled out in the persistently poor regions of the country if the primary consideration is to ameliorate historical deficits in human capital and overall well being of the regions.
There is some precedent for effective federal investment. In an evaluation of the introduction of the Appalachian Regional Development Act in 1965, research showed that the ARDA reduced Appalachian poverty between 1960 and 2000 by 7.6 percentage points relative to the rest of the U.S., and 4 percentage points relative to border counties. These anti-poverty gains were most pronounced in the Central Appalachian region. Most of the benefits were realized in the first five years of the law when the investment was largest. This suggests that federal involvement will be most effective if it well targeted and sustained.
James P. Ziliak Founding Director of the Center for Poverty Research at the University of Kentucky where he holds the Carol Martin Gatton Endowed Chair in Microeconomics in the Department of Economics. Dr. Ziliak’s research interests are in the areas of labor and public economics, with a special emphasis on U.S. tax and transfer programs, poverty measurement and policy, and inequality.